On Saturday, Berkshire Hathaway (BRK-A) , (BRK-B) , the investing conglomerate run by Warren Buffett and Charlie Munger, released the firm’s operating results for the second quarter.
For the three month period ended June 30th, the firm generated total revenue and investment gains of $125.564B. Investment and derivative gains improved to $25.869B from $-53.038B for the year ago period. Operating earnings popped for a 6.7% year over year gain to $10.043B.
Total costs and expenses amounted to $80.64B, leaving EBIT of $45.435B. After accounting for taxes, company-wide net earnings attributable to shareholders for the period printed at $35.912B, up from $-43.621B for the year ago comp. In terms of (EPS) earnings per share, this comes to $24,775 (vs. $-29,663) for the A shares and $16.52 ($-19.78) for the B shares.
Operating Earnings by Business Segment
– Insurance, underwriting produced operating earnings of $1.247B (+74.4%).
– Insurance, investment income produced operating earnings of $2.369BB (+24.3%).
– BNSF produced operating earnings of $1.264B (-24%).
– Berkshire Hathaway Energy Company produced operating earnings of $785M (-0.5%).
– Other Businesses produced operating earnings of $3.503B (+7.8%).
– Non-Controlled Businesses produced operating earnings of $535M (+194%).
– Other produced operating earnings of $340M (-62.7%).
Fundamentals
For the first six months of the fiscal year, Berkshire has driven operating cash flow of $21.127B. Over that time, the firm has spent $8.398B in property, plant and equipment. That leaves free cash flow of $12.729B. Out of this number, Berkshire repurchased $5.85B worth of its own stock. The balance moved either into cash or was used to pay down debt.
Glancing at the balance sheet, Berkshire ended the quarter with a cash position of $169.73B (+10.4% over six months) and equity investments of $353.409B (+14.5% over six months). Inventories stood at $25.295B (essentially flat). This left total assets at $1,041T (+9.8% over six months).
Total liabilities less equity comes to $489.812B, including $125.347B in notes payable and other borrowings. That majority of this debt is tied to the railroad business. Obviously, this balance sheet is strong given its debt to cash ratio of 0.74.
Wall Street
Given the size and scope of this firm, as well as the share price of the A stock, there is not a huge following on Wall Street. I am long the B stock personally, so when I offer you my opinion below, it will be geared toward the B stock given its affordability relative to the A stock.
Brian Meredith is a five star rated (at TipRanks) analyst at UBS. Meredith rates both the A and B stocks as “buys.” This morning, Meredith raised his target price for the B stock from $405 to $414, and his target price for the A stock from $608K to $621,591 (not a misprint).
My Thoughts
I find investing in Warren Buffett as one way to invest in the market itself, but from a more value driven perspective. You invest in ETFs, you’re probably in Action Alerts PLUS holding Apple (AAPL) , you invest here, you’re in Apple as well. Otherwise, you are in insurance, railroads, T-Bills, banking, energy, and even ice cream plus a whole lot more.
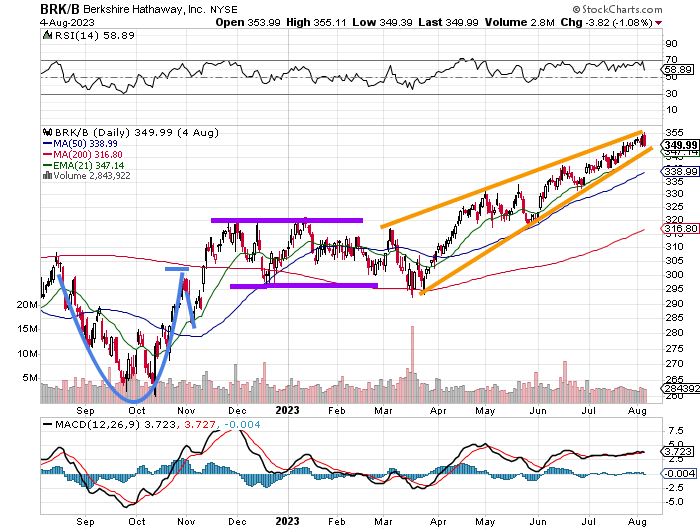
In the above chart, readers will see last autumn’s cup with handle (remember that one?) pattern with the $300 pivot that broke out, but halted abruptly at the $320 level, well short of our $360 target at the time. The shares then consolidated over four months, only to resume the upward march, forming a rising wedge pattern.
This is awesome for us because it completes our move toward our target. However, rising wedges are often patterns of reversal, especially when volume withers at the higher prices. This chart meets these conditions.
For that reason, I will take something off of my long position this morning. That is our code of discipline once targets are met. This also protects us against a reversal. As to the balance of my long… I don’t have a current pivot, so I’m feeling around a little. We’ll take or target up to $400 until we see a new pattern develop.
In the meantime, the panic point will be pulled up to $337, which would be a break of the stock’s 50 day SMA (simple moving average).
(Apple is a holding in the Action Alerts PLUS member club. Want to be alerted before AAP buys or sells AAPL? Learn more now.)
Get an email alert each time I write an article for Real Money. Click the “+Follow” next to my byline to this article.
[ad_2]