All the major equity indexes, except one, closed higher Tuesday, which left all but one index chart in near-term bullish trends.
Importantly, however, the warning signals we have been discussing have intensified to the point that suggest the odds of a correction of some degree are becoming increasingly more likely.
Notably, overly bullish investor sentiment combined with consistently declining forward 12-month earnings estimates for the S&P 500 (see below) suggest the market is very overvalued — and this implies current market risk is quite high, leaving equities vulnerable to downward adjustments.
We remain very cautious in our near-term outlook as we continue to honor sell signals and raise cash levels for better buying opportunities.
Most Indexes Rise as Nasdaq Breadth Weakens
On the charts, only the Dow Jones Transports closed lower Tuesday as the rest advanced.
Yet the NYSE internals were mixed while Nasdaq internals were negative.
Most closed near their session midpoints, which resulted in no technical events of import being generated.
The end of the day found their near-term trends all bullish except for the Russell 2000 (see below), which is still neutral.
Cumulative market breadth remains positive for the All Exchange and NYSE but the Nasdaq’s dropped to neutral from bullish.
Regarding stochastic readings, no new bearish crossover signals were generated.
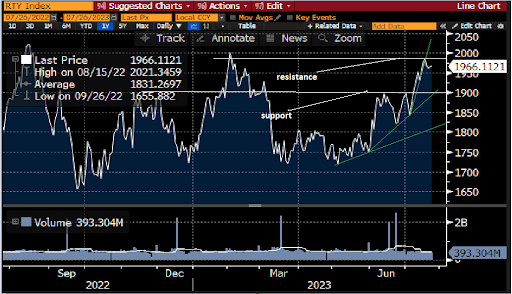
Chart Source: Bloomberg
Caution Signals Persist
The data side of the scale is becoming increasingly more weighted to the probabilities of a forthcoming correction, especially regarding sentiment and valuation.
The McClellan 1-day Overbought/Oversold Oscillators still in neutral territory (All Exchange: +11.03 NYSE: +31.13 Nasdaq: -1.14).
However, the percentage of S&P 500 issues trading above their 50-day moving averages (contrarian indicator) remains bearish at 87% and at a level that presaged market corrections of note twice in the past two years.
The Open Insider Buy/Sell Ratio rose to 37.0 and remains neutral.
The detrended Rydex Ratio (contrarian indicator) turned mildly bearish from neutral as it rose to 0.95.
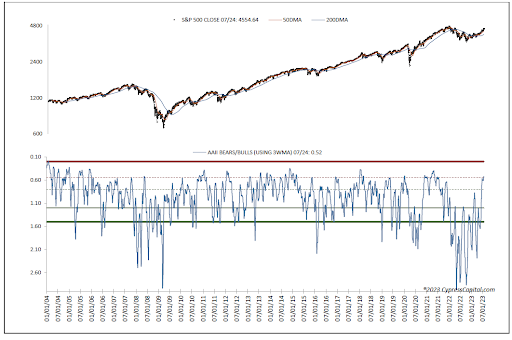
We would also highlight this week’s AAII Bear/Bull Ratio (contrarian indicator) at 0.52, which officially turned bearish due to the preponderance of bulls.
The AAII Bear/Bull Ratio (using 3WMA) Is 0.52 (Bearish)
Also, the Investors Intelligence Bear/Bull Ratio (contrary indicator) remained bearish as well at 18.0/54.2.
The “crowd” is loaded to the eyeballs with bulls.
Additionally, the Leveraged ETF sentiment (contrarian indicator) remains very bearish at 69.2 and has been this high only twice in the past decade. Both times a correction followed.
S&P Forward Estimates Drop Further
Valuation has stretched even further. The forward 12-month consensus earnings estimate from Bloomberg for the S&P 500 dropped to $220.99 per share. It still implies valuation remains quite extended with the S&P’s forward P/E multiple now at 20.7x versus the “rule of 20” ballpark fair value of 16.1x, leaving little room for error.
The S&P’s forward earnings yield is 4.84%.
The 10-Year Treasury yield closed higher at 3.91% and above resistance. Support is 3.83% with new resistance at 3.97%.
Bottom Line
Sentiment and valuation are at levels that imply market risk is quite high. Caution is advised.
Get an email alert each time I write an article for Real Money. Click the “+Follow” next to my byline to this article.
[ad_2]